MoodJam 2
2012
I worked on the first version of MoodJam at the end of 2006. I stopped working on MoodJam for a while because I was finishing my Ph.D. dissertation.
In 2011, I attended the Quantified Self Europe Conference in Amsterdam. During one of the conference breakfasts, I met Laurie Frick who makes wonderful art with self-tracking data. She told me about a new project that she was working on with colorful laminated tiles. She said the project was inspired by a website called MoodJam. Surprised and excited that I would meet a MoodJam user thousands of miles from my home town, I exclaimed "I made MoodJam." Inspired by this chance meeting, I prepared a new version of MoodJam, which I released on January 1, 2012.
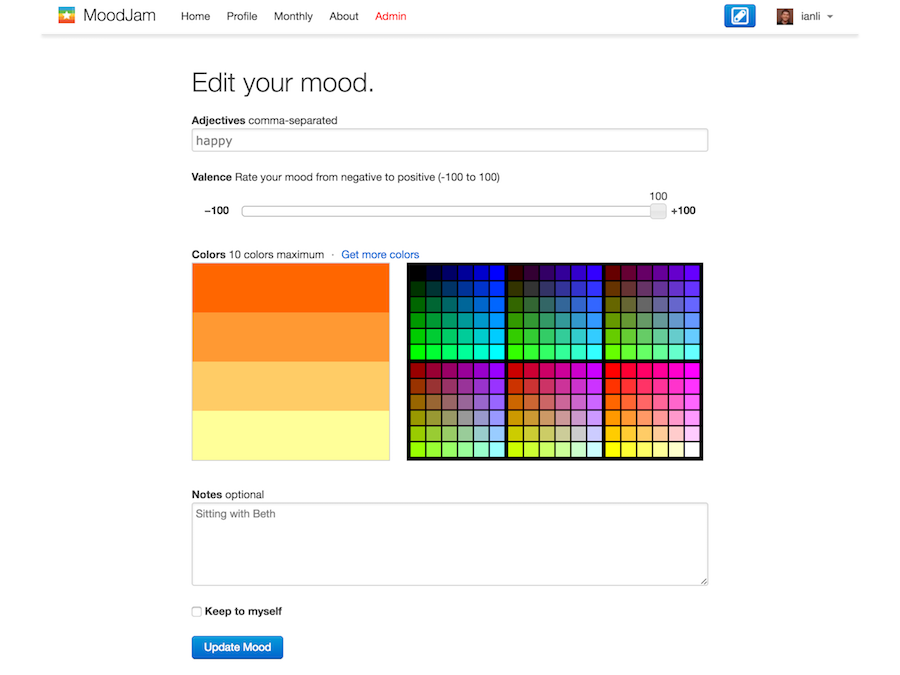
This version of MoodJam has a new home page and a new logo. Moods are now visualized as squares with bands of colors.
I also added a banner to make it easier for users to log in.

Users can also describe the valence of their moods (positive vs. negative) in addition to adjectives, colors, and notes.
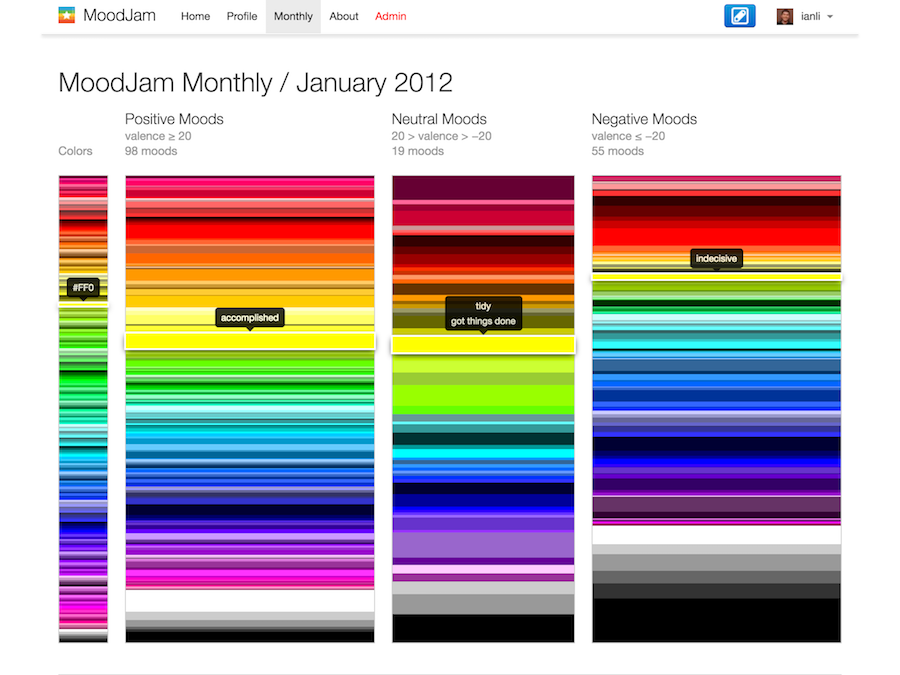
I used the valence of moods to visualize how often certain colors are used for a month's worth of moods. Notice how warm colors were used more often for positive moods (valence ≥ 20), while cool colors were used more often for negative moods (valence ≤ 20).